

¿Los conductores de transporte público perciben el peligro apropiadamente en las carreteras de montaña?
INVENTUM
Corporación Universitaria Minuto de Dios, Colombia
ISSN: 1909-2520
ISSN-e: 2590-8219
Periodicity: Semestral
vol. 15, no. 29, 2020
Received: 31 May 2020
Accepted: 15 June 2020
Published: 15 July 2020
Abstract: Public transport drivers, due to their daily exposure, should have a remarkable level of hazard recognition on mountain roads. Therefore, the objective of this research was to analyze their hazard perception capabilities. We photographed twelve road sites in mountainous topography, and showed it to 97 participants. The hazard perception was collected with an online survey and compared with the objective hazard, which was calculated using the iRAP methodology. We found that the majority of drivers could not recognize the hazards of the most dangerous places, which is worrying, especially given that these are actual real-world roads that they must traverse. It calibrated four equations to predict the objective hazard based on perceived hazard. No differences were found in the hazard perception based on years of experience and types of licenses. The results of this study will allow road safety institutions to create specific courses for drivers with inadequate hazard perception, or improve the training process for candidate drivers.
Keywords: public transport drivers, hazard perception, objective ha- zard, iRAP.
Resumen: Los conductores de transporte público, debido a su exposición diaria, debieran tener un buen nivel de reconocimiento de peligros en las carreteras de montaña. Por lo tanto, el objetivo de esta investigación fue analizar la percepción del peligro de los conductores de transporte público. Para ello, se fotografiaron 12 sitios de carreteras en topografía montañosa y se les mostraron a 97 participantes. La percepción del peligro, recolectada con encuesta en línea, se comparó con el peligro objetivo, el cual se calculó mediante la metodología iRAP. Como resultado, los conductores no reconocen los peligros de los sitios más peligrosos, lo cual es preocupante, especialmente en este tipo de carreteras. Se calibraron 4 ecuaciones para predecir el peligro objetivo en base al peligro percibido. No se encontraron diferencias en la percepción del peligro en base a los años de experiencia y a los tipos de licencia. Los resultados de este estudio permitirán que las instituciones encargadas de la seguridad vial generen cursos específicos para este tipo de conductores, o mejoren el proceso de formación de los aspirantes a conductores.
Palabras clave: conductores de transporte público, percepción del peligro, peligro objetivo, iRAP.
Palavras chave: motoristas de transporte público, percepção de perigo, perigo objetivo, iRAP
Do public transport drivers perceive hazards properly on mountain roads?
Abstract
Public transport drivers, due to their daily exposure, should have a remarkable level of hazard recognition on mountain roads. Therefore, the objective of this research was to analyze their hazard perception capabilities. We photographed twelve road sites in mountainous topography, and showed it to 97 participants. The hazard perception was collected with an online survey and compared with the objective hazard, which was calculated using the iRAP methodology. We found that the majority of drivers could not recognize the hazards of the most dangerous places, which is worrying, especially given that these are actual realworld roads that they must traverse. It calibrated four equations to predict the objective hazard based on perceived hazard. No differences were found in the hazard perception based on years of experience and types of licenses. The results of this study will allow road safety institutions to create specific courses for drivers with inadequate hazard perception, or improve the training process for candidate drivers.
Keywords: public transport drivers, hazard perception, objective hazard, iRAP.
I.INTRODUCTION
It is well known in the literature that novice drivers are more involved in traffic accidents than experienced ones [1]. One reason is that the driving task itself is complex [2]. It is not enough to learn how to operate the vehicle controls or know the traffic laws. It is necessary to develop perceptual and cognitive skills [1] to traverse roads safely. These skills are acquired through their experience [3]. An experienced driver could more quickly predict dangerous situations [4], [5], have shorter reaction times [6], detect more hazards [7], etc. than novice drivers. Despite these results, experienced drivers still have room to improve [8], when compared to other elite drivers such as police or ambulance drivers, or even public transport drivers.
Generally, public transportation drivers spend a large number of hours in a moving column behind the wheel. They are subjected to high workloads due to fluctuations in traffic, weather conditions, unpredictable passengers’ moods, etc. No other type of driver has this combination of challenges that demand remarkable perceptual and cognitive skills. Given the nature of their work, they travel hundreds of kilometers, and it would be expected that they could easily detect road hazards; that is, their hazard perception is more developed. However, very little has been studied on this topic. There have been two investigations: one with taxi drivers [3] and another with novice and experienced bus drivers [9]. Therefore, it is necessary to deepen the hazard perception that these drivers have.
Hazard perception is the ability to predict dangerous situations that may happen on the road [10], that is, to detect the possible elements that may involve them in traffic accidents or, when it happens, the features that could increase crash severity. Expert drivers (police) respond significantly faster than experienced drivers [11]. The expert driver spends many hours training to this effect, while the experienced driver has only feedback from his own experience. In this context, the public transport driver should fall somewhere in between, being more exposed than the experienced ones, but less trained than the expert driver.
Hazard perception can be estimated using four methodologies: road scenes in photos [12], videos
of real trips [3], [13], simulators [9], [13], and driving onsite [12]. Further details can be seen in [14]. To calculate this perception, the reaction time in which the driver detects the hazard has been primarily used [14]. Also, this study employed the survey/interview to investigate indepth the risks that drivers detect [12]. Generally, the hazard perception is compared with the actual hazard of the road. When both are the same, drivers may get the information that could help them to avoid traffic accidents and its consequences.
An actual hazard is an objective measure of danger on the roads. It analyzes several attributes of the roads and their influence on the frequency and severity of traffic accidents, which are calculated based on previous crash statistics. A widely employed methodology is the International Road Assessment Programme (iRAP) [15], which assigns stars from 1 to 5 (1 = dangerous road, 5 = least dangerous road) to sites or sections of the road. iRAP, in addition to sharing the technical reports online, also has an online software called ViDA
[16] to calculate actual hazards easily.
According to the literature, public transportation drivers have particular characteristics and their hazard perception has been poorly investigated. It is necessary to analyze this perception because they are responsible for transporting goods and people. In this scenario, the objective of this article is to analyze the hazard perception of public transport drivers on mountain roads. Hazard perception was estimated using twelve photographed sites. These subjective hazards were compared with the objective hazard (actual hazard) by applying iRAP methodology. In presenting the results, the rest of the article is structured as follows. The next section details the materials and methods that were employed to collect and process the data. Next, the results of the experiments with photographs are analyzed. Finally, we present the conclusions of the study.
II. MATERIALS AND METHODS
To analyze the hazard perception it planned an experiment using road scenes in static photos. Drivers that work in public transport participated in this study. The data collected were processed and compared with the actual hazard. Further details are presented below.
A. Drivers selection
Driver selection was the product of a nonprobabilistic choice. One hundred drivers participated in the study. Three of them were eliminated due to inconsistencies in their responses (they placed a single value in all the scenarios). Participants were required to be public transport drivers of taxis, vans, or buses that frequently drive on mountain roads. In this study, 93 respondents were male drivers, and the rest were female. Also, 84 % had a type D license, and 16 % had a type E license. Type E allows them to drive public transport and heavy vehicles, which they can acquire only after first acquiring a type D license. Regarding the experience, 10.3
% had between 2 to 5 years of experience, 26.8 % had between 5 to 10 years, and 62.9 % had more than ten years of driving experience.
B. Sites selection
Measurement sites represent those places on the road where hazard perception and actual hazard were assessed. Given the mobility restrictions caused by COVID-19 [17], the sites were collected from photographs on the Internet. These places belong to Ecuadorian mountain roads. In total,
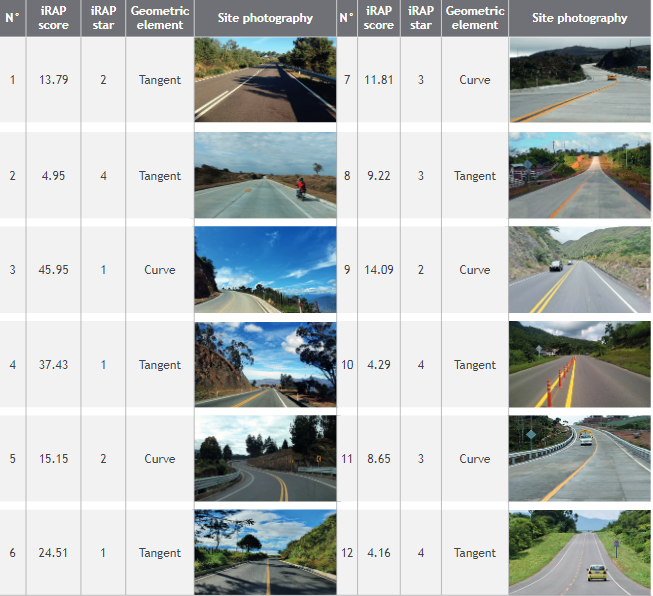
12 sites were selected that had, according to the iRAP methodology, between 1 and 4 stars. No roads qualified as 5-star hazards. The summary of the sites can be seen in Table 1. It was mandatory that the photographs were taken from the driver’s perspective. Moreover, the photos had a minimum resolution of 1360 × 768 pixels. Finally, some road features were estimated indirectly by employing local studies, such as the models of operating speeds for this roads [18].
C. Survey
A survey was employed as an instrument to collect data. Considering the mobility restrictions, it was conducted online and asynchronously. The survey comprised two questions: How dangerous do you consider this site? (1 = not dangerous at all, 10 = very dangerous); What elements of this site do you consider as dangerous? For the second question they should mention the road features that they considered dangerous. The survey was designed so that participants could complete it themselves on their personal computers. The survey instrument was previously validated by a few drivers to assess if the questions were understood and if it was intuitive. After validation, data collection began.
D. Data collection and processing
The survey was conducted using Google Forms [19] and distributed using the email databases of the main intercantonal and interprovincial public transport lines in Loja (Ecuador). Static photos were shown to participants for 2 seconds, after which they could not see them again. It employed this time as a simulation of driving a vehicle at
60 km/h. This speed could be representative of mountain roads. Furthermore, 2 seconds is enough time to perceive the road features and formulate a judgment about the scene shown in the photograph [20]. Then the photo was hidden and the respondents answered the survey. After collecting the data, the average hazard drivers’ perception was calculated. The hazard perception (scaled to 5) was compared to the actual danger of the iRAP. The iRAP methodology examines the geometric and operational attributes of the road and assigns them a numerical score based on how safe the road section is for users. This score is then converted into stars (1 = highest danger, 5
= lowest danger). Five crash types are included in this iRAP model: run-off, head-on, head-on overtaking, intersection, and property access. In every crash, there are four or five factors to consider: likelihood, severity, operating speed, external flow influence, and median traversability. This complex model has 78 attributes that help to calculate the actual danger. The iRAP results are shown in the table 1. In addition to this iRAP star rating, dangerous road features perceived by the study sample were analyzed. Results were calculated, after the data processing, using the Minitab 14.2 statistical software [21].
III. RESULTS
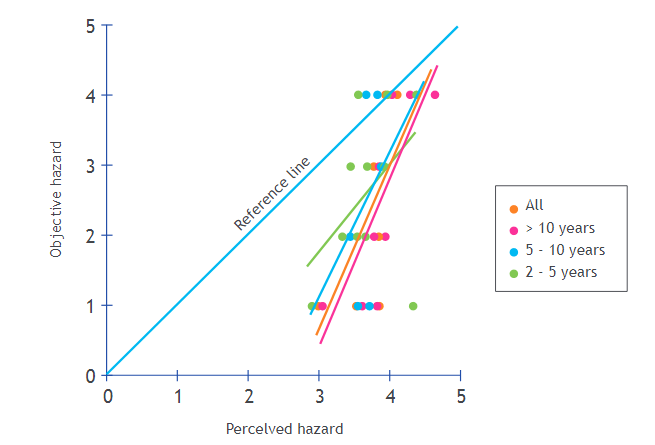
First, a scatter plot was drawn between the objective hazard and the actual one (see figure 1). Next, the points according to years of driving experience were highlighted. Figure 1 shows that plot with few calibrated equations with linear regression. In the figure, a reference line has been drawn, which indicates where the objective danger matches the actual hazard. According to the results, public transport drivers perceive the most dangerous places (1, 2 stars) as less dangerous. They also underestimate danger at intermediate sites with three stars, while with four, they had mixed results. This last case is not critical for road safety since they do not represent a significant threat.
However, it is worrying that the most dangerous sites are not correctly detected by public transport drivers, which increases the traffic accident statistics. In Ecuador, the first probable cause of traffic accidents is due to the driver’s lack of skill [22]. This mismatch between the objective and the perceived hazard shows that the training must be improved in driving schools, and, moreover, that a training plan must be drawn up for those who have already acquired their professional driving license.
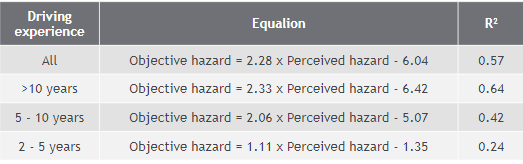
On the other hand, four equations were calibrated based on the years of experience of the drivers (see also figure 1). The first equation is for the entire sample and the following equations were divided into three ranges of experience: 2-5 years, 5-10 years, and >10 years. All the equations were calibrated using simple linear regression. The determination coefficients (R2) range from 0.24 to 0.64. These equations shows that experienced drivers (5-10 years and >10years) have similar equation values (slope and constant value); thus
so only one could be calibrated. Drivers with experience of 2-5 years have a similar slope than the reference line; however, it is located downwards.
With these results, drivers with less than five years of experience must follow a different retraining plan than those with more than five years.
The perception errors of each driver were also analyzed based on the objective hazard of the 12 sites. The Mean Absolute Percentage Error (MAPE) was employed, which is the average of the errors between the actual hazard and its perception. Using the MAPE results, including the years of experience and the type of driver’s license, an interval plot was plotted as shown in figure 2. The interval plot shows the confidence interval for the mean in every condition. It should be noted that when the
MAPE gets closer to zero, it means that the driver has fewer errors in estimating the actual hazard, and when it moves away from zero, the opposite happens. On average, those with the fewest errors are drivers with 2-5 years of experience, then the drivers with 5-10 years, and finally those with more than ten years (figure 2, left). Error dispersion decreases as years of experience increase. Contrary to the literature, hazard detection improves with driving experience; however, in this case, it
worsens. Possibly it is because drivers with more than ten years of experience, although they may better recognize the danger; but, aging physical conditions, e.g. decreased vision, do not allow them to detect it. A Student’s t-test was performed to conclude if drivers with different years of experience responded statistically differently
to the 95% level of confidence. Between 2-5 and 5-10 there was no statistical difference (p-value
= 0.320) and between 5-10 and >10 no difference was detected either (p-value = 0.610); therefore, despite observing these graphic differences, statistically all the drivers responded similarly to the road hazard survey.
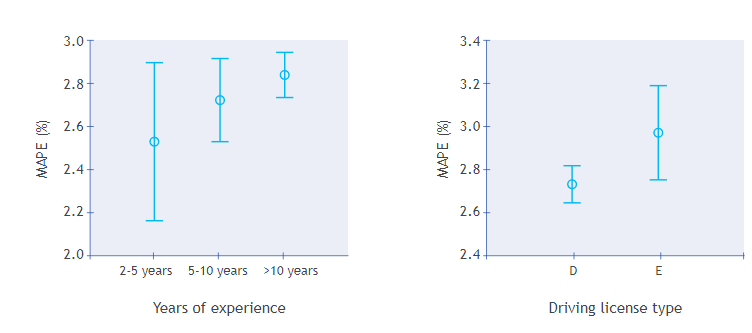
The differences between drivers with type D and E licenses were also evaluated as seen to the right in figure 2. Drivers with E license have higher errors for those with type D. They also have a much larger dispersion. This trend is also possibly due to the limitations that occur with the aging of drivers. Errors between the two types of licenses were compared with Student’s t-test and were not statistically different (p-value = 0.056); however it was very close to 0.05.
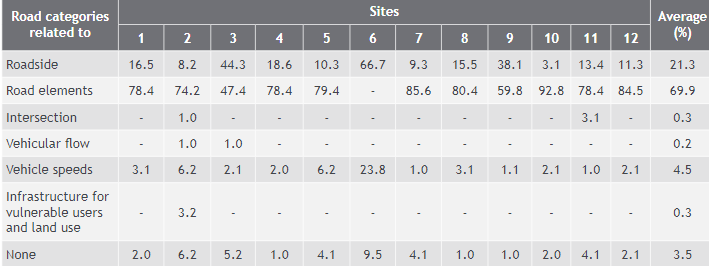
Drivers also responded to the most dangerous features in every study site. Those elements were grouped into the following categories: roadside,
road geometry, intersections, vehicular flow, vehicle speeds, infrastructure for vulnerable users, and none (they did not answer this question) (see table 2).
The dangerous attributes detected by drivers were linked to the geometry of the road, including: lane widths, grades, visibility, etc. The elements of the lateral zones were also recognized. The first’s ones could lead them to a traffic accident, while the latter could increase its severity. These categories are primarily related to design, not road operation. The rest of the categories can also affect both the probability of accidents and their severity.
IV. CONCLUSIONS
This paper aims to analyze the hazard perception of public transport drivers on mountain roads. The actual hazard of 12 highway sites was calculated using the iRAP methodology, then compared to the hazard perception of 97 drivers. The conclusions of that analysis are presented below.
Drivers do not recognize correctly hazardous sites on mountain roads (1-2-3 stars), which is troubling given that these are public transportation drivers. In less hazardous places (4 stars) mixed results were observed. These sites are not a threat since they are the least dangerous section along roads. Based on the relationship between actual and perceived danger, four equations were it calibrated. Moreover, no statistically significant differences were found between the years of driving experiences and between the types of licenses. Regarding the hazardous road attributes, drivers mainly recognize those related to road geometry and its roadside. Few drivers mentioned road operation characteristics, which maybe it is a limitation of the use of photographs, but this should be analyzed in future studies.
The study includes drivers who drive on mountain roads every day. Being more exposed than other types of drivers, it is expected that they can correctly detect road hazards. However, our results indicate to the contrary. Critically, if
public transport drivers do not properly recognize hazards, they can make poor decisions that could lead to road accidents. In such cases, both material and human losses may be incurred. These types of drivers are a greater risk than other types of drivers since they drive large trucks that transport goods (for example, tons of food) or buses with passengers (for example, 30 people).
Very few studies have analyzed the hazard perception of public transport drivers. Despite having experimented with taxi drivers or experienced bus drivers, it has not been analyzed in mountainous environments. Mountain roads have a lower workload than urban streets, which is where these studies were conducted. This level of workload is because there is less information to process (fewer pedestrians, less traffic, fewer distractions, etc.). However, these roads have a higher workload than others in level or rolling terrain due to their geometric design. Furthermore, in these areas, in low traffic flows, vehicles can reach high speeds, which represents a serious road safety problem, since this speed increases the risk of collision and the severity of the accident. In conclusion, mountainous roads are one of the most unfavorable scenarios for any type of driver, and it is more sensitive for public transport drivers, who have the responsibility to transport passengers or goods. Therefore, knowing the hazard perception that they have on these roads will serve to prevent costly and irreparable losses.
This study has several limitations. It was performed with photographed sites and not in vivo on real trips with drivers. Therefore, an attempt to simulate this last condition was made by hiding the photograph after the driver had seen it only for 2 seconds. Also, there was no balanced distribution between men and women; however, in the country, public transport drivers are generally men. Despite these limitations, this research helps to understand the hazard perception of public transport drivers.
This study represents pioneering research since it has not been previously carried out in the region or the country. Also, the study focused on mountain roads, which are more complex to drive. Moreover, it presents four equations that can be used to estimate the objective hazard based on subjective hazard. The results of this study help the road safety institutions to promote courses on this topic for both candidate drivers and licensed drivers.
V. ACKNOWLEDGEMENT
The authors acknowledge the support of the National Secretariat of Higher Education, Science, Technology and Innovation (SENESCYT) and Universidad Técnica Particular de Loja from the Republic of Ecuador.
REFERENCES
[1] H. A. Deery, “Hazard and Risk Perception among Young Novice Drivers,” J. Safety Res., vol. 30, no. 4, pp. 225–236, 1999. https:// doi.org/10.1016/S0022-4375(99)00018-3
[2] J. Hall and R. West, “Role of formal ins- truction and informal practice in lear- ning to drive,” Ergonomics, vol. 39, no. 4, pp. 693–706, Mar. 1996. https://doi. org/10.1080/00140139608964490
[3] A. Borowsky and T. Oron-Gilad, “Exploring the effects of driving experience on hazard awareness and risk perception via real-time hazard identification, hazard classification, and rating tasks,” Accid. Anal. Prev., vol. 59, pp. 548–565, 2013. https://doi. org/10.1016/j.aap.2013.07.008
[4] D. Crundall, “Hazard prediction discriminates between novice and experienced drivers,” Accid. Anal. Prev., vol. 86, pp. 47–58, Jan. 2016. https://doi.org/10.1016/j. aap.2015.10.006
[5] S. E. Lee et al., “Detection of road hazards by novice teen and experienced adult dri- vers,” Transp. Res. Rec., vol. 2078, no. 2078, pp. 26–32, 2008. https://doi.org/10.3141/ 2078-04
[6] T. S. A. Wallis and M. S. Horswill, “Using fuzzy signal detection theory to determine why ex- perienced and trained drivers respond faster than novices in a hazard perception test,” Accid. Anal. Prev., vol. 39, no. 6, pp. 1177– 1185, Nov. 2007. https://doi.org/10.1016/j. aap.2007.03.003
[7] G. Underwood, “Visual attention and the transition from novice to advanced driver,” Ergonomics, vol. 50, no. 8, pp. 1235–1249, Aug. 2007. https://doi. org/10.1080/00140130701318707
[8] M. S. Horswill, K. Taylor, S. Newnam, M. Wetton, and A. Hill, “Even highly experienced drivers benefit from a brief hazard perception training intervention,” Accid. Anal. Prev., vol. 52, pp. 100–110, Mar. 2013. https://doi. org/10.1016/j.aap.2012.12.014
[9] L. Dorn and J. Stannard, “Simulator per- formance differences between experienced and novice bus drivers,” University of Roma TRE, 2006.
[10] M. S. Horswill and F. P. McKenna, “Drivers’ hazard perception ability: Situation awareness on the road,” in A Cognitive Approach to Situation Awareness, Ashgate, 2004, pp. 155–175.
[11] F. P. McKenna and J. L. Crick, “Hazard per- ception in drivers: a methodology for testing and training | TRL,” Jan. 1994.
[12] Beca, “Actual and perceived risk and effects on driver behaviour report,” New Zealand, 2014.
[13] S. Bromberg, T. Oron-Gilad, A. Ronen, A. Bo- rowsky, and Y. Parmet, “The perception of pedestrians from the perspective of elderly experienced and experienced drivers,” Ac- cid. Anal. Prev., vol. 44, no. 1, pp. 48–55, Jan. 2012. https://doi.org/10.1016/j.aap.2010. 12.028
[14] C. Moran, J. M. Bennett, and P. Prabhakha- ran, “Road user hazard perception tests: A systematic review of current methodolo- gies,” Accid. Anal. Prev., vol. 129, pp. 309– 333, Aug. 2019. https://doi.org/10.1016/j. aap.2019.05.021
[15] “iRAP - International Road Assessment Pro- gramme.” [Online]. Available: https://www. irap.org/. [Accessed: 02-Mar-2020].
[16] IRAP, “ViDA,” 2. [Online]. Available: https:// vida.irap.org/es/home. [Accessed: 04-Mar- 2020].
[17] Ministerio de Salud Pública, “Coronavirus COVID 19 – Ministerio de Salud Pública,” 2020. [Online]. Available: https://www.salud.gob. ec/coronavirus-covid-19/. [Accessed: 03- Jun-2020].
[18] Y. D. García-Ramírez and F. Alverca, “Calibración de Ecuaciones de Velocidades de Operación en Carreteras Rurales Montañosas de Dos Carriles: Caso de Estudio Ecuatoriano,” Rev. Politécnica, vol. 43, no. 2, pp. 37–44, Jul. 2019. https://doi. org/10.33333/rp.vol43n2.1012
[19] Google, “G Suite: Aplicaciones de colabora- ción y productividad para empresas,” 2020. [Online]. Available: https://gsuite.google. com/intl/es-419/. [Accessed: 14-Jul-2020].
[20] G. Šimaitė and A. Česnulevičius, “Vairuotojų reakcijos tyrimas [Examination of drivers‘ reaction time],” Jaun. Moksl. darbai, vol. 2, no. 40, pp. 63–66, 2013.
[21] State College, “Minitab 14.2 Statistical Software [Computer program].” PA: Minitab, Inc., 2005.
[22] ANT, “Estadísticas sobre Siniestros de Tránsito,” Estadísticas de siniestros de tránsito - Agencia Nacional de Tránsito del Ecuador, 2020. [Online]. Available: https:// www.ant.gob.ec/index.php/estadisticas. [Accessed: 17-Feb-2020].

